Digital Twins - Generative AI Extensions of Qualitative Survey Data
Qualitative data, such as survey and interview responses, are vital but expensive tools for understanding context and motive behind user behavior. This research expands existing survey data by ‘twinning’ individual respondents or demographic groups through the use of adaptive prompting of large language models (LLMs) to predict unasked questions beyond the original survey scope.
Surveys - direct, insightful and expensive.
Collecting survey data at any scale can be very expensive. Average costs, quality, and pricing structures vary widely even within providers; Survey Monkey estimates costs of one dollar per respondent to beyond three dollars per response with targeted and balanced respondents, displaying different pricing with each option. Mechanical Turk utilizes a ‘set your own rate’ structure with questionable quality (Aguinis et al., 2020). This research utilizes the National Science Foundation (NSF) funded General Social Survey, which collects roughly three thousand respondent answer sets biannually, at an operating budget of roughly $4 million a year (NSF 20-550: General Social Survey (GSS) Competition | NSF, 2020) (NSF 24-537: General Social Survey Competition | NSF, 2024).
The survey model of directly asking individuals their opinions is generally seen as a reliable and useful way to collect data as long as the survey is well designed. Surveys have a long history in research and industry; however, conducting surveys is far from the only method to gather opinions in the modern era. Many social media users identify information overload as a concern (Bontcheva et al., 2013), and opinions are ubiquitous online. This offered information is exactly the type of data collected in popular LLM training datasets Common Crawl and WebText2. Common Crawl is an open source dataset comprised of scraped web data of mixed quality, while WebText2 is composed of reddit posts and comments filtered by upvotes. These two datasets are the most heavily weighted of the training corpus for Open AI’s GPT-3 (Brown et al., 2020b).
LLMs trained on large corpuses of web data have an enormous scale of opinion data embedded in their structure, and this research seeks to utilize and augment that data by supplying contextual prompts that paint a picture of the ‘person’ or group that the model should emulate while answering. This process creates a ‘digital twin’ of a survey respondent through the metabolized web data latent in the model, which we can then use to answer questions that were not supplied in our context prompt.
Our work shows very promising results with very little optimization, suggesting that current LLMs can be used to extend survey data to unasked questions. In subsequent sections, we explore the dataset used for this proof of concept, the retrieval augmented generation (RAG) pipeline we developed, results, and areas for exploration.
A similar approach from Brox AI provides an important and much needed modernization of survey data in the CPG space - a subscription model with relatively fast turn around for new survey rounds with ‘AI Panelists’ used to predict sentiment between rounds of data. Our approach also seeks to predict the unknown opinions of respondents, however we do not need a respondent to have previously been asked about CPG products in the past to suppose a novel response on the topic. Using this pipeline design we can remix multiple surveys, multiple respondents, and multiple data types to provide model context from new angles and for new insights. Tickr’s strength is melding disparate data sources. We have experience combining survey data with CPG panel data for client projects. This ‘digital twin’ approach gives us the opportunity to explore qualitative and creative opinion grounded in real purchasing data.
Contact us at info@tickr.com if you would like to explore using these techniques to rapidly and accurately predict consumer attitudes and behaviors.
The pipeline described below was developed as a proof of concept, and is composed of segments we thought were needed for bare functionality. We did not optimize context sets, prompt formats, embedding models, or LLM selection.
Data set and model
For this proof of concept we are using the publicly available GSS dataset, which collects two rounds of 1500 responses every two years. This survey specifically works to collect responses from a representative cross section of the United States, with respondents selected at random and recruited into the study resulting in a cohort of respondents from a wide variety of backgrounds. The survey questions change slightly every year, with a core set of demographic and attitudinal questions collected every round. Due to the long history of this survey (biannually since 1972) and shifting attitudes over time we are using only the 2022 dataset for now. To decrease compute, we selected one hundred respondents as a meaningful subsample, creating a balanced set along self identified political party, sex, and race. These are the respondents that our pipeline seeks to ‘twin’, anticipating their attitudes to unseen questions given the context of their other survey responses.
Subsample distributions compared to 2022 GSS respondent distributions:
| Party ID* | Sex | Race | ||||||
|---|---|---|---|---|---|---|---|---|
| Subsample | GSS 2022 | Subsample | GSS 2022 | Subsample | GSS 2022 | |||
| Strong Democrat: | 32% | 17.0% | Female: | 54% | 53.8% | White: | 75% | 72.0% |
| Not very strong Democrat: | 25% | 12.9% | Male: | 46% | 46.2% | Black: | 16% | 16.2% |
| Strong Republican: | 23% | 12.3% | Other: | 9% | 11.8% | |||
| Not very strong Republican: | 20% | 10.3% |
*Our subsample did not include PartyID categories “Independent (neigher, no response)” (23.7% of original data), ‘independent, close to democrat" (11.4% of original data), “independent, close to republican” (9.4% of original data), and “other party” (3.0% of original data).
Full list of respondent IDs used in testing are listed in appendix-1.
Each question in the survey is uniquely identified by its Schema ID, which we will be using throughout this post. Question text for individual IDs, and the distribution of raw data associated with them, can be found at the GSS Data Explorer: https://gssdataexplorer.norc.org/. The survey data was preprocessed into clean question text, answer texts, and schema keys that can be easily paired with survey responses.
Example survey responses from responded ID-1, demographic information:
| Schema | Question | ID_1_Answer |
|---|---|---|
| wrkstat | Last week were you working full time, part time, going to school, keeping house, or what? | working full time |
| wrkslf | (Are/Were) you self employed or (do/did) you work for someone else? | someone else |
| wrkgovt1 | (Are/Were) you employed by the government? (Please consider federal, state, or local government.) | no |
Example survey responses from respondent ID-1, attitudinal information:
| Schema | Question | ID_1_Answer |
|---|---|---|
| natroad | (… are we spending too much, too little, or about the right amount on) Highways and bridges | about right |
| natsoc | (… are we spending too much, too little, or about the right amount on) Social Security | too little |
| natmass | (… are we spending too much, too little, or about the right amount on) Mass Transportation | about right |
To test our proof of concept, we held out 45 ‘attitude’ questions (Question ID and text in appendix-2). This is our ‘target questions’ set, opinions of the respondents which we are trying to anticipate with our pipeline. The rest of the questions were partitioned into two groups: Core Demographics and Auxiliary Opinion.
Core Demographic questions illustrate the factual situation or state of the respondents life, and will be included in the context set for every test question. This set is composed of 54 questions specifying age, race, sex, education, income, who the respondent voted for in the last presidential election and more (question IDs and text for core demo set in appendix-3).
Auxiliary Opinion questions qualify the general position and outlook of the respondent, and are composed of 118 questions about a wide range of topics such as feelings about people of other races, religious preference, and taxation (question IDs for auxiliary set in appendix-4). This later set is entered into the vectorstore and dynamically searched to supply context to specific questions, and the top 46 are added to the prompt context.
The total question-answer context supplied to the model is a combination of the core demographic question set, which is always supplied to the model, as well as a specialized set of auxiliary questions from the vector store for a total of 100 context questions. This ensures that the total amount of text is always smaller than the context window while still being flexible and specialized to the target question. This is farther described in the “Develop Context” section of the pipeline illustrated below.
Our pipeline utilized the LangChain Python library, which enables us to incorporate prompt templates, a vector store, reranker and output formatting from each pipeline segment into an easy to use function. Questions were summarized before vectorstore search with checkpoint gpt-3.5-turbo-0125 from OpenAI, which in our experience had great performance with lower compute costs. For our vector store we used a Chroma vectorstore embedded with OpenAI’s text-embedding-ada-002 embedding model, which were chosen for good performance. Once results were returned from the vectorstore, we re-ranked them with Flash ReRank (Damodaran, 2023) running the reranking model rank-T5-flan, which we chose for it’s zero shot out of sample performance and ease of use. For answer prediction we used gpt-4o-2024-05-13, the state of the art flagship OpenAI model at the time of writing.
RAG Pipeline
Our pipeline can be defined in two parts: Context development and prompting.
Retrieval Augmented Generation (RAG) is one method of prompt engineering to increase the accuracy of responses provided by LLMs. In RAG the prompt to the LLM is accompanied with contextual information that can be used by the LLM to generate better responses, such as relevant passages from books on the topic of question, or chat history of a customer that the model is asked to provide information to. RAG can be conceptually divided into two parts, context development and prompting. Our pipeline creates context on both a per-question and per-respondent level as the context question set is customized to the target question, and the question-answer pairs supplied to the model are specific to the respondent we are trying to twin.
Each segment of the pipeline is explained below:

Context Development
Our pipeline begins by selecting a target question. For this example our target will be question id confinan:
“(I am going to name some institutions in this country. As far as the people running this institution are concerned, would you say you have a great deal of confidence, only some confidence, or hardly any confidence at all in them?) Banks and financial institutions”.
With the following possible answers:
[‘a great deal’, ‘only some’, ‘hardly any’]
We initially process this question with our first LLM call, using gpt-3.5-turbo-0125, to extract a concise summary of the question topic using the prompt:
“What is the topic of the following question enclosed in <>? State only the topic and nothing else. <{question}>”.
This greatly improves the vector store results by minimizing formatting overlap and disregarding instructions to the respondent, instead shifting focus to the heart of the question and creating more meaningful embeddings. Our example question text is summarized as 'Confidence in banks and financial institutions’. Now, instead of retrieving unrelated questions that are strictly about spending or use the same ‘great deal, only some, hardly any’ scale, we get questions with similar topics.
The vector store returns the questions in the Auxiliary Opinion set ordered by similarity between the embedding of the question and embedding of the summarized target text. This ordered set is then passed to the re-ranker, Flashrank running the rank-T5-flan model. Re-ranking is used as a secondary ordering step, to re-order the results using a cross encoding model that orders based on similarity score between the target text and returned records. Of these reordered results, the top 46 are returned.
Provided below are the top five questions returned by the ranked vector search, when searched for embedding similarity to the summarized question topic 'Confidence in banks and financial institutions’:
| Question ID | Question Text |
|---|---|
| satfin | We are interested in how people are getting along financially these days. So far as you and your family are concerned, would you say that you are pretty well satisfied with your present financial situation, more or less satisfied, or not satisfied at all? |
| workblks | Now I have some questions about different groups in our society. I'm going to show you a seven-point scale on which the characteristics of people in a group can be rated. In the first statement a score of 1 means that you think almost all of the people in that group are “rich.” A score of 7 means that you think almost everyone in the group are “poor.” A score of 4 means you think that the group is not towards one end or another, and of course you may choose any number In between that comes closest to where you think people in the group stand. The second set of characteristics asks if people in the group tend to be hard-working or if they tend to be lazy. Where would you rate blacks in general on this scale? |
| workwhts | Now I have some questions about different groups in our society. I'm going to show you a seven-point scale on which the characteristics of people in a group can be rated. In the first statement a score of 1 means that you think almost all of the people in that group are “rich.” A score of 7 means that you think almost everyone in the group are “poor.” A score of 4 means you think that the group is not towards one end or another, and of course you may choose any number In between that comes closest to where you think people in the group stand. The second set of characteristics asks if people in the group tend to be hard-working or if they tend to be lazy. Where would you rate whites in general on this scale? |
| helpsick | In general, some people think that it is the responsibility of the government in Washington to see to it that people have help in paying for doctors and hospital bills. Others think that these matters are not the responsibility of the federal government and that people should take care of these things themselves. Where would you place yourself on this scale, or haven’t you made up your mind on this? |
| relactiv | How often do you take part in the activities and organizations of a church or place of worship other than attending services? |
We can see that these questions, while not exactly the same as the target question, do appear to address related concepts such as the respondents perception of their own financial position, attitudes towards other large groups of people (in this case racial groups, although the question text includes financial terms such as ‘rich’ and ‘poor’), opinion on government financial support, and participation or belief in broader community systems. Overall, these questions help position the respondent politically and socially.
The questions returned from our vector store and reranker are then combined with the standardized set of 54 core demographic questions that is the same for every target question. These are basic, factual questions that describe the state and history of the respondent such as age, marriage status, general location within the United States, any political leanings or affiliation, income level, changes in income, family size, and more. The combined set is processed into a set of 100 question-answer pairs, with answers unique to each respondent and context question composition unique to each target question.
By combining these two sets we create an adaptable, individualized user description that combines ‘state descriptor’ information and relevant attitude information. We can also use this combined approach to keep the question set small enough to easily fit the token limit and avoid ‘lost in the middle’ problems with LLM knowledge utilization (Liu et al. 2023).
Prompting the Model
Using a LangChain prompt template to create an easy to use pipeline, the question-answer pairs are supplied as the system prompt:
"You are a survey respondent, described by the following question answer pairs: {context}"
The target question’s original text ({question}) and possible answers ({answers}) as the ‘human’ prompt:
"Think about your history of answers to similar survey questions, along with your demographic, to answer the following question: {question}. Answer only in one of the following ways enclosed in []. Include no punctuation, only the answer text: {answers}"
The answer set supplied in ({answers}) is randomized, so the order of answers is different every time we prompt our chosen LLM used for answer prediction (gpt-4o-2024-05-13). This increases performance of the pipeline by preventing positional bias - the consistent selection of a response based only on its position on the list, such as always picking ‘c’ in a multiple choice question. Our pipeline’s performance at sentiment matched responses increased by 2.95% and raw ground truth percent correct remained the same after adding answer randomization to our pipeline. More information on sentiment grouped responses can be found in the “Matching Sentiment” section.
The model response is then post processed to remove any errant text or spaces. In the case of responses that are not exact matches for the supplied answer list another call to gpt-3.5-turbo-0125 gives us the closest allowable answer.
Both GPT 3.5 Turbo and GPT 4o are used in this pipeline depending on the task. When strong inference, creativity, and depth of training knowledge are required we use GPT 4o, such as when asking for the respondent answer. When direct, simple answers with obvious ground truths are required we use the cheaper GPT 3.5 Turbo, such as in summarization and matching text to answer sets. The OpenAI portfolio of models were chosen for their well regarded performance, status as a standard of the field, and ease of use.
Results
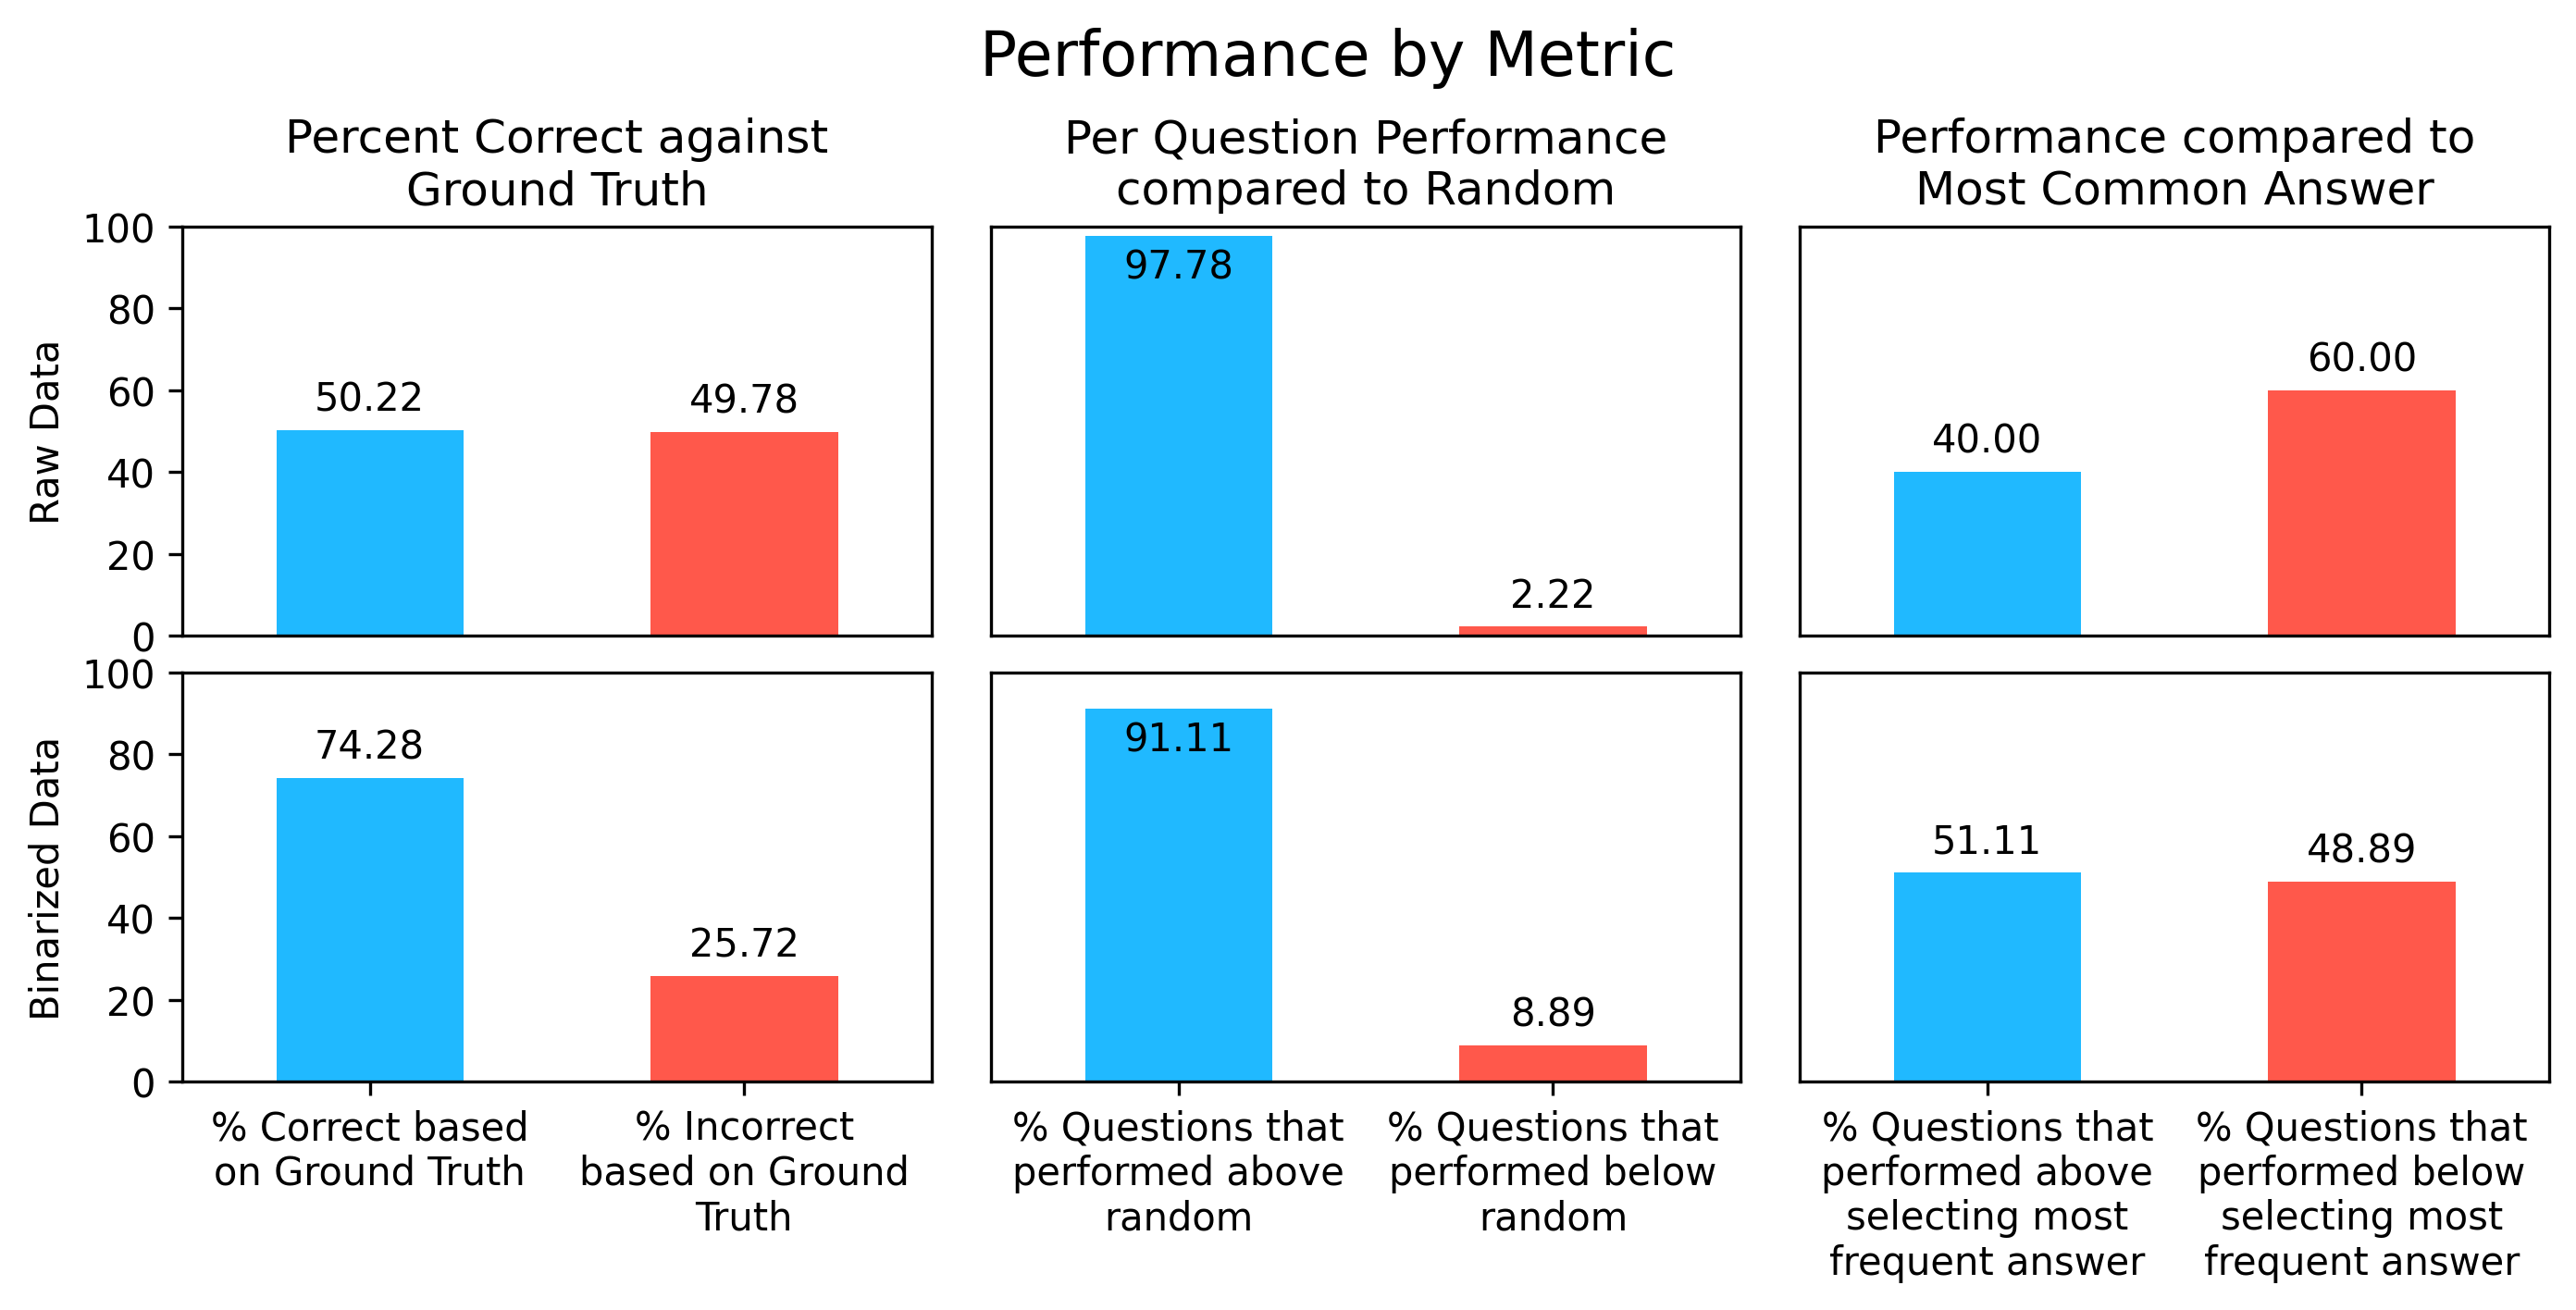
How does one assess “good” performance at mimicking someone’s opinions? We took a few approaches to assess performance at twinning responses - direct matches, results vs. random, results vs. most popular response, and matching sentiment (here shortened to Binarization).
Exact match to ground truth
The first and most salient assessment is a simple match between the answer provided by the pipeline and the ground truth answer provided by the respondent. Here our pipeline returns an exact match to ground truth 50.22% of the time, with varying performance by question. As the number of possible responses increases, the percent of exact matches decreases. As explored in the matching sentiment section, the utility of exactly matching ground truth as a measure of success decreases as the size of the pool of answers increases.
Results vs. Random
Most of the questions asked have at least three possible answers, ranging from 2 to 7 valid choices. Getting a correct match in an answer set becomes more impressive as the size of the set increases, and the proportion of ‘correct’ answers that can be gained through chance decreases. The percent of correct answers by randomly selecting answers can be calculated like so:
Where n is the number of questions in the target question set, and for each question we take 100 divided by the count of possible answers to that question divided by the the fraction of total number of questions n.
Random chance on this dataset is 30.24%, and our overall performance (exact match between ground truth and pipeline output) of 50.7% is a significant improvement. Performing better than random is the absolute baseline for any proof of concept, and our pipeline performs well above random.
On a per-question basis, every question but one, or 97.8% of questions asked, performed better than random. The only question that performed below random was ‘fefam’, with pipeline performance at 23.7% compared to random performance of 25.0%. There is more information on this question and its performance in the “Exploring Target Question Performance” section.
Results vs. Popular choice
Another metrics to benchmark our results against is answer selection by ‘popular choice’. This data set is highly skewed; as social norms change over time the most prevalent answers to each question shift, and some questions have become dominated by a single answer. A well performing pipeline should have better performance than simply picking the most prevalent answer to each question. This assessment shows that the LLM is discerning enough to calibrate responses based on the supplied context, and that it is able to identify the majority position at least most of the time. This is the most challenging assessment of the three, as success in this measure relies on correctly assigning minority or unlikely opinions. Only 40% of questions out performed choosing only the most popular answer, when matching to ground truth. This is calculated using the distribution of answers in the subset of respondents from the year polled, in this case the respondent IDs in appendix-1 and GSS survey year 2022.
Below we have plotted per-question performance with a dashed line for the ‘random performance’ cutoff and a bar for ‘majority question’ performance (percent correct if only the most popular question was chosen by the pipeline). Percent correct shown in Blue.
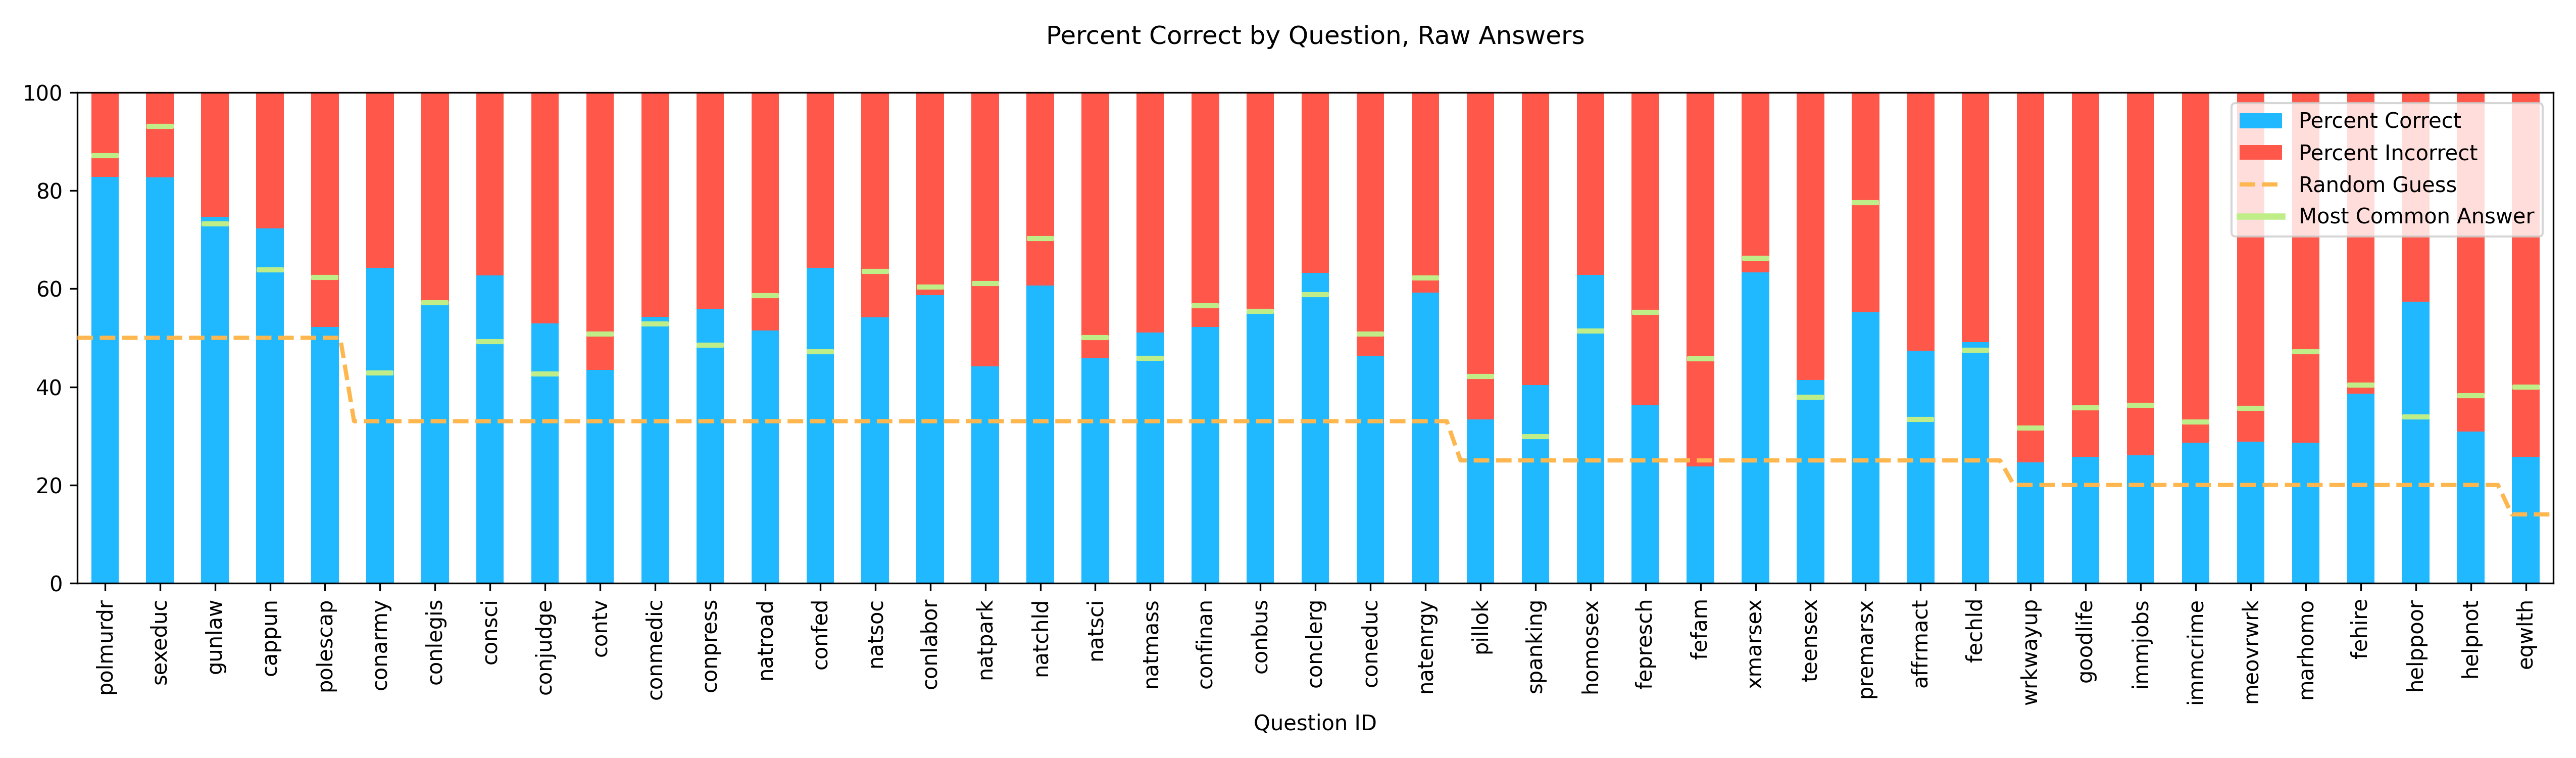
We can see that as the total number of answers in the set increases, chance of getting the correct answer by random decreases and the orange line goes down. With this decrease in performance by random chance, our overall percent correct also decreases but generally persists well above performing at random. We can also see that where the answer distributions are less skewed, as in where the green ‘Most Common Answer’ line is closer to the orange “Random Guess” line, the pipeline performs better than a majority class selection strategy. Performance at beating the majority class is further improved by matching sentiment as described below.
Matching Sentiment
When we turn from observing our results to actually using them, the sometimes arbitrary nature of the answer schemas come to light. The wide range of scales used - from “yes” and “no” to “rate on a scale from 1 to 7” are nuanced and useful for the GSS survey creators but can be overly complex for the type of prototyping digital twin respondents are most likely to be used for.
Instead, a simple “positive” and “negative” sentiment gives us plenty of information, and the more complicated answer scales can be grouped together into two functional groups. The difference between “agrees very much” and “mostly agrees” is not very actionable from a developer standpoint, and can simply become “positive”. By grouping sentiment into two categories “Positive Sentiment” and “Negative Sentiment”, we binarize the data and simplify the output.
For example, for the question “confinan” the three possible answers [‘a great deal’, ‘only some’, ‘hardly any’] are binarized as [‘Positive’, ‘Negative’, ‘Negative’]. The original distribution of answers is 16.0% ‘a great deal’, 56.5% ‘only some’, and 27.5% ‘hardly any’, so the majority answer benchmark for direct ground truth matches is 56.5%. Once binarized the distribution is 16.0% ‘Positive’ and 84.0% ‘Negative’, so the binarized most common answer benchmark for sentiment matching is 84.0%.
Below we have the same question specific performance graph, now binarized by sentiment, with the same dashed line cutoff for random performance, which is now 50% for all questions, and green marker for the most dominant category. Percent correct in blue:
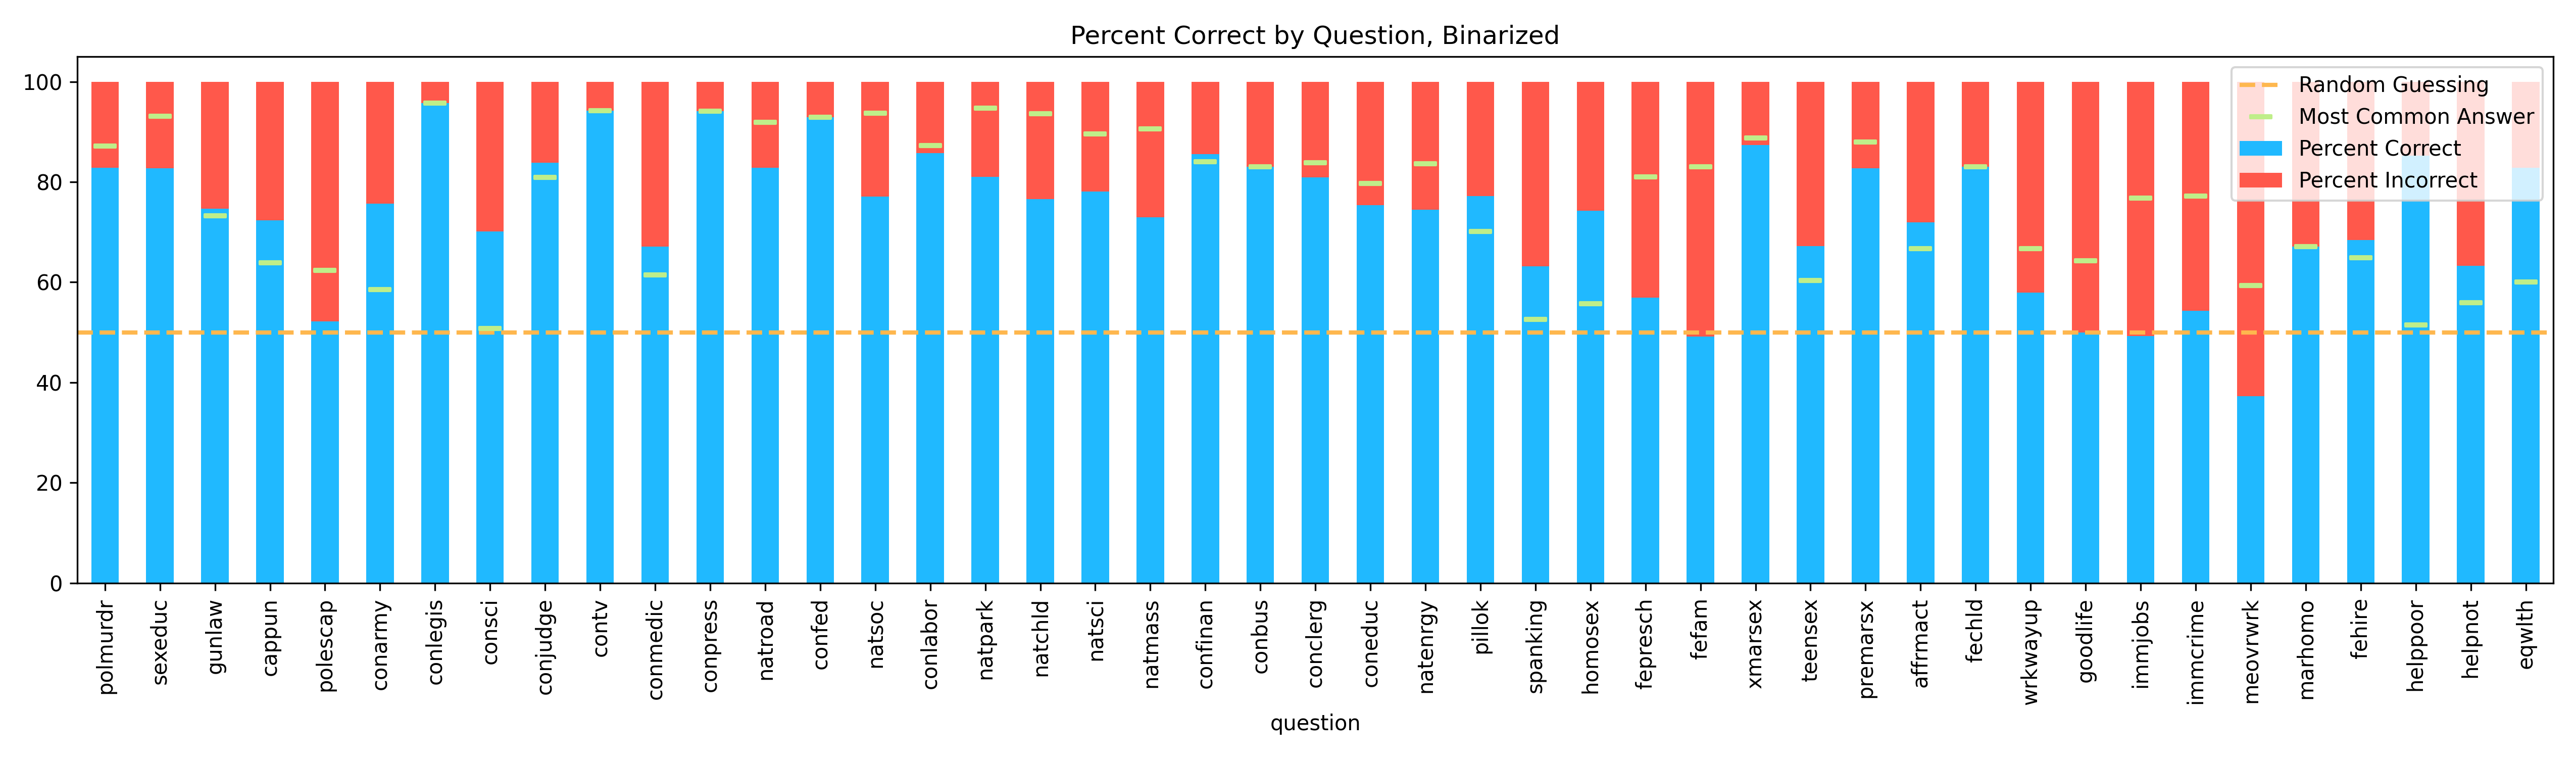
Once sorted by sentiment, our overall model performance is 74.3% correct, performs better than random for 91.1% of questions, and performs better than selecting the most prevalent answer for 51.1% of the test questions.
Exploring Target Question Performance
Not all questions perform well, and the worst performing questions vary in performance depending on whether direct pipeline outputs or sentiment matched results are used. Below are the three worst performing questions for raw outputs:
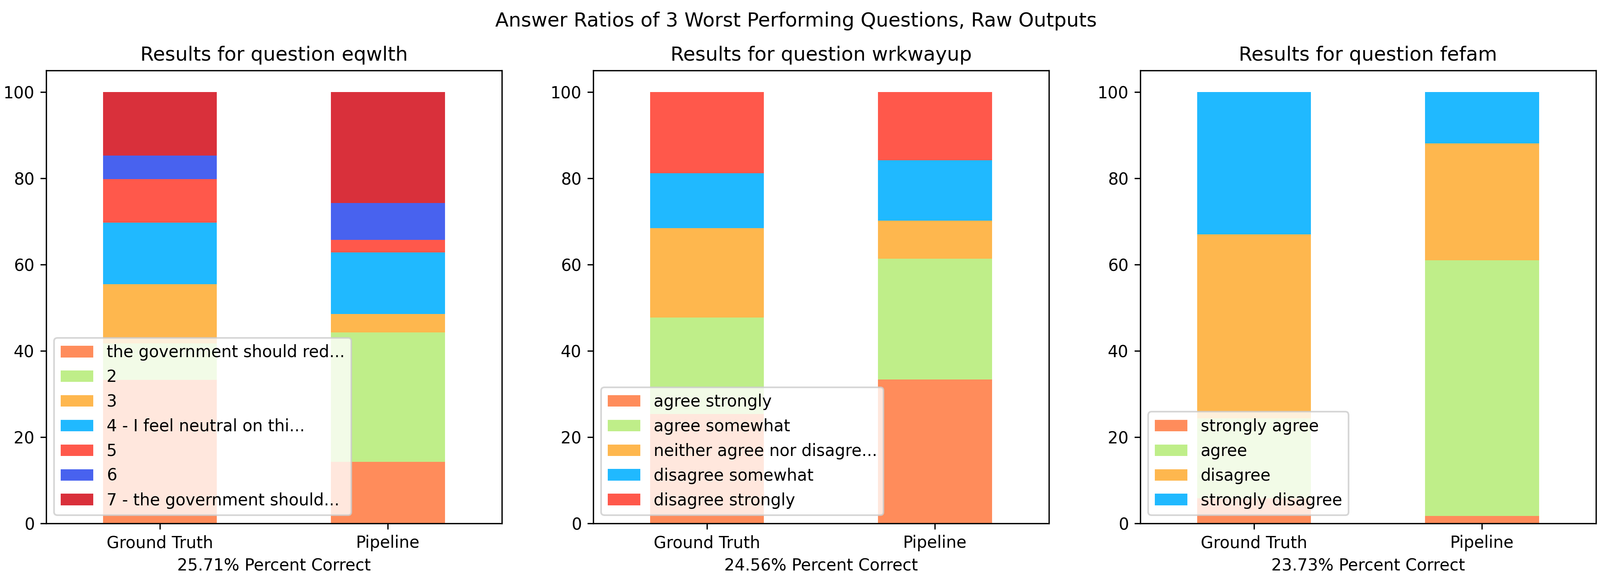
Immediately it’s clear that these are among the questions with the most possible answers. The question associated with id “eqwlth” has the largest answer set of any target question, with 7 possible responses. If we assess our question set by grouping answer sentiment into “positive” and “negative” responses to mitigate the effect of many choice answer sets, our performance increases substantially:
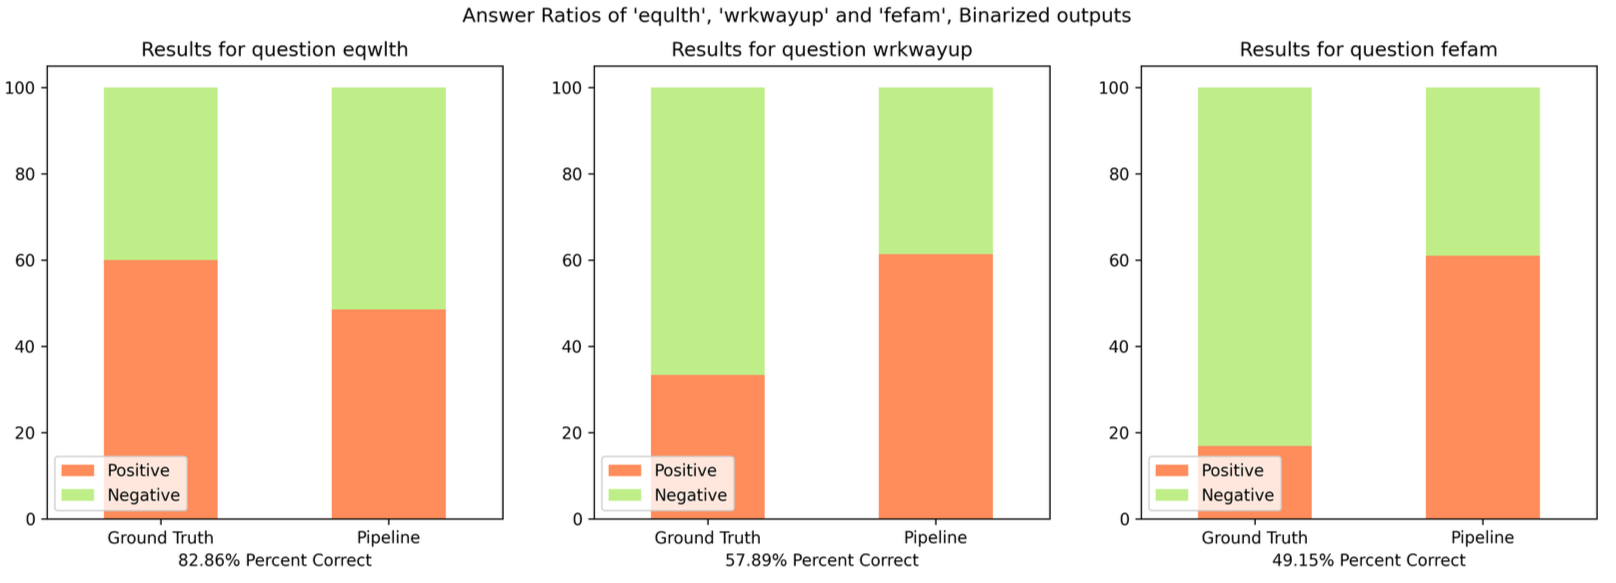
This is a good illustration of why grouping by sentiment can increase pipeline efficacy while preserving the most useful aspects of survey responses.
This begs a new question, which questions are the lowest performing once grouped by sentiment? Here are our new lowest performers:
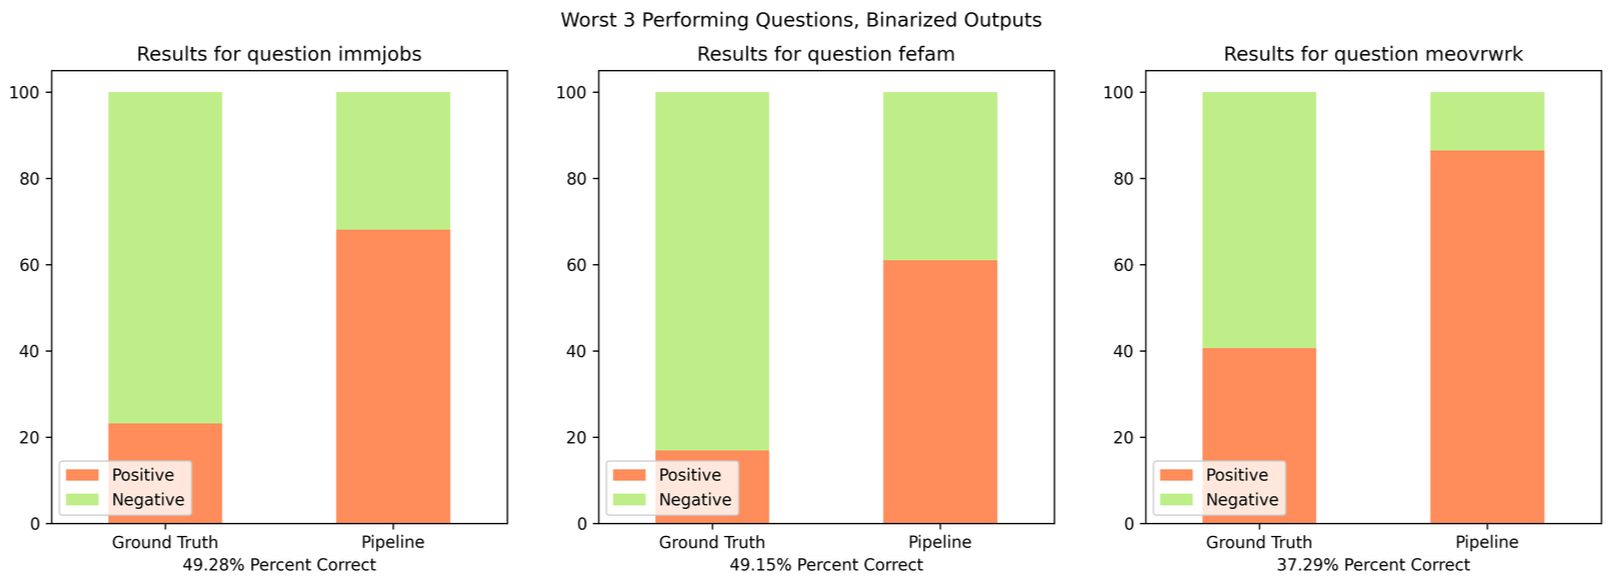
Interestingly, ‘fefam’ persists in this set. Here is the question text for these three poor performers:
| Question ID | Question Text |
|---|---|
| immjobs | There are different opinions about immigrants from other countries living in America. (By “immigrants” we mean people who come to settle in America.) How much do you agree or disagree with each of the following statements? Immigrants take jobs away from people who were born in America |
| fefam | (Please read the following statements and indicate whether you strongly agree, agree, disagree, or strongly disagree with each statement…) It is much better for everyone involved if the man is the achiever outside the home and the woman takes care of the home and family. |
| meovrwrk | Family life often suffers because men concentrate too much on their work. |
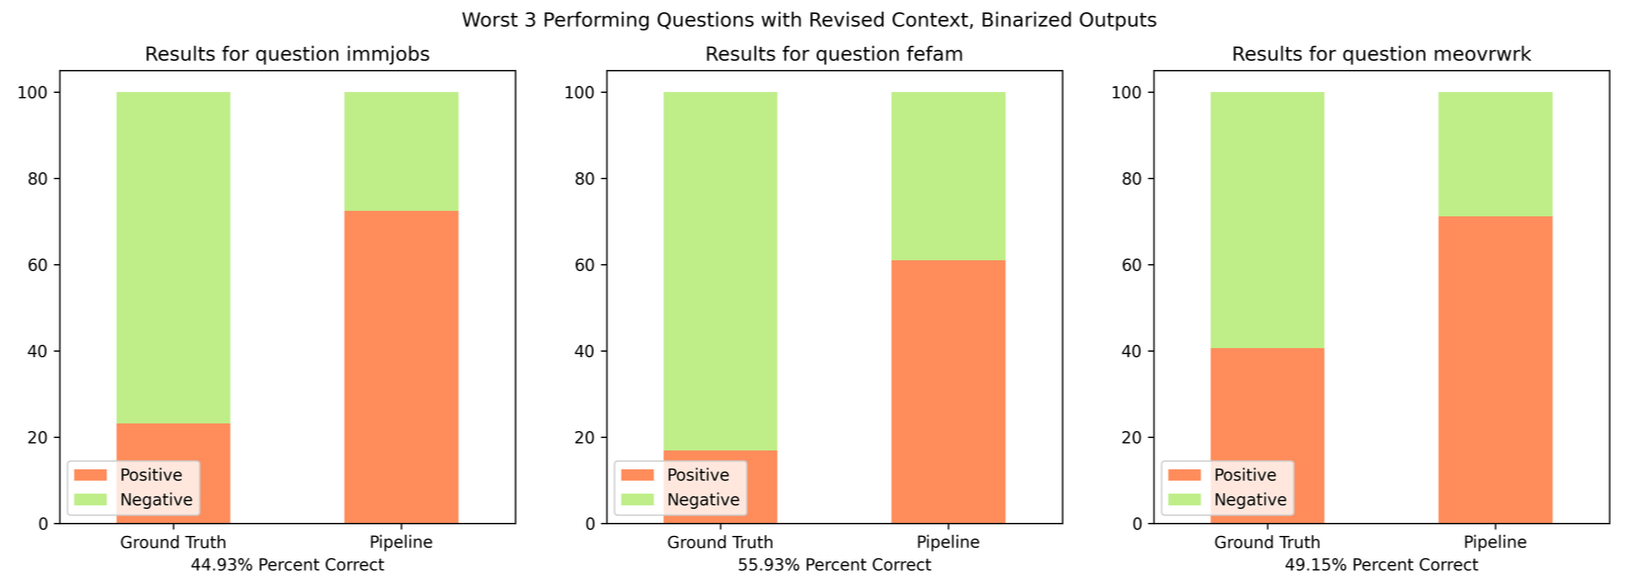
For each of these answers, the model responses were far more positive than the ground truth, indicating agreement with the question or statement despite the context that may suggest the respondent thought otherwise. Two of these three questions are specific to gender rolls, but are generally thought to be opposite - people who would agree that a man’s place is working outside the home would also generally disagree that this harms family life, but here the model agrees with both sentiments. This suggests that it is not the models ‘moral leanings’ or ‘true thoughts’, but instead a misapplication of its world view architecture based on some piece of context. This is evidenced by running the pipeline again with different context:
Original context questions from vector store, supplied along side the static demographic question set, context questions that remained the same between the two sets are highlighted:
| Question ID | Original Context | Alternate Context |
|---|---|---|
| immjobs | [‘hispanic’, ‘fund16’, ‘vetyears’, ‘sexbirth1’, ‘helpblk’, ‘emailmin’, ‘workwhts’, ‘wksup1’, ‘workblks’, ‘union1’, ‘intlblks’, ‘wksub’, ‘pornlaw’, ‘finalter’, ‘life’, ‘notsmart’, ‘relig16’, ‘satfin’, ‘tax’, ‘letin1a’, ‘helpsick’, ‘socrel’, ‘intlwhts’, ‘dwelown’, ‘workhard’, ‘raceacs10’, ‘wksub1’, ‘wwwmin’, ‘thnkself’, ‘wwwhr’, ‘happy’, ‘evstray’, ‘racecen1’, ‘sprtprsn’, ‘reborn’, ‘popular’, ‘chldidel’, ‘discaff’, ‘god’, ‘socommun’, ‘raceacs3’, ‘marhisp’, ‘partfull’, ‘othlang’, ‘parsol’, ‘marwht’] | [‘intlhsps’, ‘cohort’, ‘unemp’, ‘raceacs2’, ‘popular’, ‘sei10’, ‘union’, ‘raceacs11’, ‘obey’, ‘immfate’, ‘wksup’, ‘zodiac’, ‘colrac’, ‘threaten’, ‘year’, ‘workhsps’, ‘hompop_exp’, ‘gunlaw’, ‘sexeduc’, ‘pasei10’, ‘raceacs13’, ‘sexnow1’, ‘rifle’, ‘raceacs12’, ‘owngun’, ‘savesoul’, ‘raceacs7’, ‘raceacs9’, ‘pistol’] |
| fefam | [‘hompop_exp’, ‘raceacs8’, ‘fund16’, ‘helpblk’, ‘masei10’, ‘immfate’, ‘emailmin’, ‘workwhts’, ‘pasei10’, ‘wksup1’, ‘colrac’, ‘marasian’, ‘emailhr’, ‘raceacs12’, ‘racerank1’, ‘raceacs4’, ‘hunt’, ‘pornlaw’, ‘relig16’, ‘relpersn’, ‘raceacs7’, ‘dateintv’, ‘relactiv’, ‘letin1a’, ‘helpsick’, ‘weekswrk’, ‘raceacs11’, ‘raceacs9’, ‘wordsum’, ‘raceacs6’, ‘colmslm’, ‘zodiac’, ‘dwelown’, ‘raceacs2’, ‘sei10’, ‘raceacs10’, ‘wwwmin’, ‘happy’, ‘year’, ‘raceacs5’, ‘raceacs14’, ‘god’, ‘raceacs3’, ‘othlang’, ‘raceacs13’, ‘marwht’] | [‘colath’, ‘socfrend’, ‘satjob’, ‘news’, ‘compuse’, ‘ethnic’, ‘fear’, ‘localnum’, ‘intlblks’, ‘cappun’, ‘pistol’, ‘attend’, ‘pray’, ‘adoptus’, ‘threaten’, ‘socbar’, ‘hompop_exp’, ‘sexeduc’, ‘health’, ‘dwelown’, ‘sexnow1’, ‘rifle’, ‘reborn’, ‘finrela’, ‘owngun’, ‘life’, ‘letin1a’, ‘shotgun’, ‘hispanic’, ‘racerank1’] |
| meovrwrk | [‘sexbirth1’, ‘helpblk’, ‘satjob’, ‘fund16’, ‘workwhts’, ‘emailmin’, ‘pasei10’, ‘workblks’, ‘unemp’, ‘marasian’, ‘emailhr’, ‘wksup’, ‘helpoth’, ‘intlblks’, ‘wksub’, ‘racerank1’, ‘raceacs15’, ‘localnum’, ‘pornlaw’, ‘finalter’, ‘tvhours’, ‘relpersn’, ‘raceacs7’, ‘tax’, ‘workhsps’, ‘weekswrk’, ‘wordsum’, ‘intlwhts’, ‘class’, ‘threaten’, ‘workhard’, ‘raceacs10’, ‘savesoul’, ‘wwwmin’, ‘wwwhr’, ‘evstray’, ‘sprtprsn’, ‘raceacs5’, ‘reborn’, ‘chldidel’, ‘god’, ‘partfull’, ‘othlang’, ‘parsol’, ‘marwht’, ‘compuse’] | [‘emailhr’, ‘emailmin’, ‘wwwhr’, ‘news’, ‘wwwmin’, ‘compuse’, ‘workwhts’, ‘dwelown16’] |
The alternate context set performed much better for ‘fefam’ and ‘meovwrk’’, the two questions about gender roles, increasing their sentiment grouped performance by 9.78% and 11.86% respectively. ‘immjobs’ performed worse with the new context, with sentiment grouped performance dropping by 4.35%. The new context set compositions were entirely due to changes in the vector store - BAAI/llm-embedder (here and here, Zhang et al. 2023) was used as an embedding model instead of the text-embedding-ada-002 model, and a similarity score cutoff (cutoff of 0.5) was used instead of top n for returning items from the store. This resulted in context question sets of variable length, and smaller more concise sets overall.
This shows there is space for optimization in context sets, as well as possible performance gains from a tuned embedding model.
Conclusion
Our RAG-pipeline performance demonstrates a clear and scalable path forward for sentiment, opinion and attitude prediction on a per-respondent level for survey data. Initial results are already usable for gauging the general temperature of respondents’ attitudes to a novel question, and with some optimization this approach could have greatly increased accuracy.
Our performance varies widely by target question, implying the pipeline provides more accurate responses with certain topics, or the responses of certain groups of respondents. Given the sensitive nature of some of the target questions, we also may be experiencing issues related to content filtering, especially for those questions that intersect with the survey’s long tradition of monitoring social temperature on racial and gender discrimination. Utilizing open source LLM’s with different approaches to safely filtering may give us a performance boost for these difficult questions.
There is even room for more traditional prompt optimization and pipeline improvements such as implementing majority voting and pairwise answer comparison, fine tuning language models and embedding models, and optimizing the length and content of context supplied to the model. Every part of our pipeline can be optimized or customized to specific tasks, specific datasets, or new combinations of data types such as survey and shopper level purchasing data.
This is a new area of exploration with few papers on this topic, and we are excited where this research could lead us.
References
Aguinis, H., Villamor, I., & Ramani, R. S. (2020). MTurk research: Review and recommendations. Journal of Management, 47(4), 823–837. https://doi.org/10.1177/0149206320969787
Bontcheva, K., Gorrell, G., & Wessels, B. (2013, June 4). Social media and information overload: Survey results. arXiv.Org. https://arxiv.org/abs/1306.0813
Brown, T. B., Mann, B., Ryder, N., Subbiah, M., Kaplan, J., Dhariwal, P., Neelakantan, A., Shyam, P., Sastry, G., Askell, A., Agarwal, S., Herbert-Voss, A., Krueger, G., Henighan, T., Child, R., Ramesh, A., Ziegler, D. M., Wu, J., Winter, C., … Amodei, D. (2020a, May 28). Language Models are Few-Shot Learners. arXiv.Org. https://arxiv.org/abs/2005.14165
Brown, T. B., Mann, B., Ryder, N., Subbiah, M., Kaplan, J., Dhariwal, P., Neelakantan, A., Shyam, P., Sastry, G., Askell, A., Agarwal, S., Herbert-Voss, A., Krueger, G., Henighan, T., Child, R., Ramesh, A., Ziegler, D. M., Wu, J., Winter, C., … Amodei, D. (2020b, May 28). Language Models are Few-Shot Learners. arXiv.Org. https://arxiv.org/abs/2005.14165
Brox. (n.d.). Brox.ai. Retrieved June 26, 2024, from https://brox.ai/
Chroma. (2024, June 21). the AI-native open-source embedding database. Trychroma.Com. https://www.trychroma.com/
Common Crawl. (n.d.). Common crawl. Open Repository of Web Crawl Data. Retrieved June 26, 2024, from https://commoncrawl.org/
Damodaran, P. (2023). FlashRank, Lightest and Fastest 2nd Stage Reranker for search pipelines. https://doi.org/10.5281/zenodo.10426927
Liu, N. F., Lin, K., Hewitt, J., Paranjape, A., Bevilacqua, M., Petroni, F., & Liang, P. (2023). Lost in the Middle: How Language Models Use Long Contexts.
National Science Foundation Directorate for Social, Behavioral and Economic Sciences Division of Social and Economic Sciences. (2020, February 27). General Social Survey (GSS) competition. NSF - National Science Foundation. https://new.nsf.gov/funding/opportunities/general-social-survey-competition/nsf20-550/solicitation
National Science Foundation Directorate for Social, Behavioral and Economic Sciences Division of Social and Economic Sciences. (2024, February 7). General social survey competition. NSF - National Science Foundation. https://new.nsf.gov/funding/opportunities/general-social-survey-competition/nsf24-537/solicitation
Papers with code - WebText dataset. (n.d.). Papers With Code. Retrieved June 26, 2024, from https://paperswithcode.com/dataset/webtext
Survey Monkey. (n.d.). Discover SurveyMonkey Audience. Survey Monkey. Retrieved June 26, 2024, from https://www.surveymonkey.com/collect/audience/calculator/preview?ut_source=pricing&ut_source2=pricing
Zhang, P., Xiao, S., Liu, Z., Dou, Z., & Nie, J.-Y. (2023).
Retrieve Anything To Augment Large Language Models.
Appendix
Respondent IDs for respondents used in this research. These respondents were subsampled from the larger body of respondents such that Party ID, Sex, and Race reflect the distributions of the parent set.
Test questions, IDs and Text. These are ‘target questions’,
Schema Question natroad (… are we spending too much, too little, or about the right amount on) Highways and bridges natsoc (… are we spending too much, too little, or about the right amount on) Social Security natmass (… are we spending too much, too little, or about the right amount on) Mass Transportation natpark (… are we spending too much, too little, or about the right amount on) Parks and recreation natchld (… are we spending too much, too little, or about the right amount on) Assistance for childcare natsci (… are we spending too much, too little, or about the right amount on) Supporting scientific research natenrgy (… are we spending too much, too little, or about the right amount on) Developing alternative energy sources eqwlth Some people think that the government in Washington ought to reduce the income differences between the rich and the poor, perhaps by raising the taxes of wealthy families or by giving income assistance to the poor. Others think that the government should not concern itself with reducing this income difference between the rich and the poor. Here is a scale from 1 to 7. Think of a score of 1 as meaning that the government ought to reduce the income differences between rich and poor, and a score of 7 meaning that the government should not concern itself with reducing income differences. What score between 1 and 7 comes closest to the way you feel? cappun Do you favor or oppose the death penalty for persons convicted of murder? gunlaw Would you favor or oppose a law which would require a person to obtain a police permit before he or she could buy a gun? affrmact Some people say that because of past discrimination, Blacks should be given preference in hiring and promotion. Others say that such preference in hiring and promotion of Blacks is wrong because it discriminates against Whites. What about your opinion? Are you for or against preferential hiring and promotion of Blacks? IF FAVORS: Do you favor preference in hiring and promotion strongly or not strongly? IF OPPOSES: Do you oppose preference in hiring and promotion strongly or not strongly? wrkwayup Do you agree strongly, agree somewhat, neither agree nor disagree, disagree somewhat, or disagree strongly with the following statement: Irish, Italians, Jewish and many other minorities overcame prejudice and worked their way up. Blacks should do the same without special favors. confinan (I am going to name some institutions in this country. As far as the people running this institution are concerned, would you say you have a great deal of confidence, only some confidence, or hardly any confidence at all in them?) Banks and financial institutions conbus (I am going to name some institutions in this country. As far as the people running these institutions are concerned, would you say you have a great deal of confidence, only some confidence, or hardly any confidence at all in them?) Major companies conclerg (I am going to name some institutions in this country. As far as the people running these institutions are concerned, would you say you have a great deal of confidence, only some confidence, or hardly any confidence at all in them?) Organized religion coneduc (I am going to name some institutions in this country. As far as the people running these institutions are concerned, would you say you have a great deal of confidence, only some confidence, or hardly any confidence at all in them?) Education confed (I am going to name some institutions in this country. As far as the people running these institutions are concerned, would you say you have a great deal of confidence, only some confidence, or hardly any confidence at all in them?) Executive branch of the federal government conlabor (I am going to name some institutions in this country. As far as the people running these institutions are concerned, would you say you have a great deal of confidence, only some confidence, or hardly any confidence at all in them?) Organized labor conpress (I am going to name some institutions in this country. As far as the people running these institutions are concerned, would you say you have a great deal of confidence, only some confidence, or hardly any confidence at all in them?) Press conmedic (I am going to name some institutions in this country. As far as the people running these institutions are concerned, would you say you have a great deal of confidence, only some confidence, or hardly any confidence at all in them?) Medicine contv (I am going to name some institutions in this country. As far as the people running these institutions are concerned, would you say you have a great deal of confidence, only some confidence, or hardly any confidence at all in them?) TV conjudge (I am going to name some institutions in this country. As far as the people running these institutions are concerned, would you say you have a great deal of confidence, only some confidence, or hardly any confidence at all in them?) U.S. Supreme Court consci (I am going to name some institutions in this country. As far as the people running these institutions are concerned, would you say you have a great deal of confidence, only some confidence, or hardly any confidence at all in them?) Scientific Community conlegis (I am going to name some institutions in this country. As far as the people running these institutions are concerned, would you say you have a great deal of confidence, only some confidence, or hardly any confidence at all in them?) Congress conarmy (I am going to name some institutions in this country. As far as the people running these institutions are concerned, would you say you have a great deal of confidence, only some confidence, or hardly any confidence at all in them?) Military pillok Do you strongly agree, agree, disagree, or strongly disagree that methods of birth control should be available to teenagers between the ages of 14 and 16 if their parents do not approve? sexeduc Would you be for or against sex education in the public schools? premarsx There’s been a lot of discussion about the way morals and attitudes about sex are changing in this country. If a man and a woman have sexual relations before marriage, do you think it is always wrong, almost always wrong, wrong only sometimes, or not wrong at all? teensex There’s been a lot of discussion about the way morals and attitudes about sex are changing in this country. If a man and a woman have sexual relations before marriage, what if they are in their early teens, say 14 to 16 years old? In that case, do you think sex relations before marriage are always wrong, almost always wrong, wrong only sometimes, or not wrong at all? xmarsex What is your opinion about a married person having sexual relations with someone other than the marriage partner–is it always wrong, almost always wrong, wrong only sometimes, or not wrong at all? homosex What about sexual relations between two adults of the same sex–do you think it is always wrong, almost always wrong, wrong only sometimes, or not wrong at all? spanking Do you strongly agree, agree, disagree, or strongly disagree that it is sometimes necessary to discipline a child with a good, hard spanking? polmurdr Would you approve of a policeman striking a citizen who was being questioned as a suspect in a murder case? polescap Would you approve of a policeman striking a citizen who was attempting to escape from custody? fepresch (Please read the following statements and indicate whether you strongly agree, agree, disagree, or strongly disagree with each statement…) A preschool child is likely to suffer if his or her mother works. fefam (Please read the following statements and indicate whether you strongly agree, agree, disagree, or strongly disagree with each statement…) It is much better for everyone involved if the man is the achiever outside the home and the woman takes care of the home and family. helppoor Next, here are issues that some people tell us are important. Some people think that the government in Washington should do everything possible to improve the standard of living of all poor Americans, they are at Point 1 on the scale below. Other people think it is not the government’s responsibility, and that each person should take care of himself, they are at Point 5. Where would you place yourself on this scale, or haven’t you made up your mind on this? helpnot Some people think that the government in Washington is trying to do too many things that should be left to individuals and private businesses. Others disagree and think that the government should do even more to solve our country’s problems. Still others have opinions somewhere in between. Where would you place yourself on this scale, or haven’t you made up your mind on this? fehire Now I’m going to read several statements. As I read each one, please tell me whether you strongly agree, agree, neither agree nor disagree: Because of past discrimination, employers should make special efforts to hire and promote qualified women. goodlife (Please tell me/Please indicate) whether you strongly agree, agree, neither agree nor disagree, disagree, or strongly disagree with the following statement: The way things are in America, people like me and my family have a good chance of improving our standard of living-- do you agree or disagree? marhomo (Do you agree or disagree?) Homosexual couples should have the right to marry one another. meovrwrk Family life often suffers because men concentrate too much on their work. fechld To begin, we have some questions about women. To what extent do you agree or disagree…? A working mother can establish just as warm and secure a relationship with her children as a mother who does not work. immcrime There are different opinions about immigrants from other countries living in America. (By “immigrants” we mean people who come to settle in America.) How much do you agree or disagree with each of the following statements? Immigrants increase crime rates immjob There are different opinions about immigrants from other countries living in America. (By “immigrants” we mean people who come to settle in America.) How much do you agree or disagree with each of the following statements? Immigrants take jobs away from people who were born in America Demographic question set, added to all context sets and always supplied to the model. Full context set is composed of these questions and the questions returned from the vectorstore:
[’sex', 'age', 'born', 'race', 'educ', 'degree', 'marital', 'widowed', 'partyid', 'polviews', 'region', 'xnorcsiz', 'income', 'wrkstat', 'vote16', 'pres16', 'vote20', 'pres20', 'wrkslf', 'wrkgovt1', 'wrkgovt2', 'occ10', 'prestg10', 'indus10', 'pawrkslf', 'pawrkslf2', 'paocc10', 'papres10', 'paind10', 'mawrkslf', 'mawrkslf2', 'maocc10', 'mapres10', 'sibs', 'childs', 'agekdbrn', 'paeduc', 'maeduc', 'padeg', 'madeg', 'dipged', 'res16', 'reg16', 'mobile16', 'family16', 'mawrkgrw', 'incom16', 'granborn', 'maborn', 'paborn', 'adults', 'unrelat', 'earnrs', 'size']Schema Question sex CODE RESPONDENT’S SEX age RESPONDENT’S AGE born Were you born in this country? race What race do you consider yourself? educ RESPONDENT’S EDUCATION degree RESPONDENT’S DEGREE marital Are you currently married, widowed, divorced, separated, or have you never been married? widowed IF CURRENTLY MARRIED, SEPARATED, OR DIVORCED: Have you ever been widowed? partyid Generally speaking, do you usually think of yourself as a Republican, Democrat, Independent, or what? polviews We hear a lot of talk these days about liberals and conservatives. I’m going to show you a seven-point scale on which the political views that people might hold are arranged from extremely liberal–point 1–to extremely conservative–point 7. Where would you place yourself on this scale? region REGION OF INTERVIEW xnorcsiz Size of your location of residence: income In which of these groups did your total family income, from all sources, fall last year before taxes, that is? wrkstat Last week were you working full time, part time, going to school, keeping house, or what? vote16 In 2016, you remember that Hillary Clinton ran for President on the Democratic ticket against Donald Trump for the Republicans. Do you remember for sure whether or not you voted in that election? pres16 Did you vote for Hillary Clinton or Donald Trump? vote20 In 2020, you remember that Joe Biden ran for President on the Democratic ticket against Donald Trump for the Republicans. Do you remember for sure whether or not you voted in that election? pres20 Did you vote for Joe Biden or Donald Trump? wrkslf (Are/Were) you self employed or (do/did) you work for someone else? wrkgovt1 (Are/Were) you employed by the government? (Please consider federal, state, or local government.) wrkgovt2 (Are/Were) you employed by a private employer (including non-profit organizations)? occ10 RESPONDENT’S OCCUPATION prestg10 PRESTIGE OF RESPONDENT’S OCCUPATION (0 to 100, higher is more prestigious) indus10 RESPONDENT’S INDUSTRY pawrkslf Was your [father/stepfather/male relative you were living with when you were 16] an employee, self-employed without employees, or self-employed with employees pawrkslf2 Was he self-employed or did he work for someone else paocc10 FATHER’S OCCUPATION papres10 PRESTIGE OF RESPONDENT’S FATHER’S OCCUPATION (0 to 100, higher is more prestigious) paind10 FATHER’S INDUSTRY mawrkslf At this job, was [mother/stepmother/female realtive you were living with when you were 16] an employee, self-employed without employees, or self-employed with employees? mawrkslf2 At this job, was (your mother/your stepmother/the female relative you were living with when you were 16) an employee, self-employed without employees, or self-employed with employees? maocc10 MOTHER’S OCCUPATION mapres10 PRESTIGE OF RESPONDENT’S MOTHER’S OCCUPATION (0 to 100, higher is more prestigious) sibs How many brothers and sisters did you have? Please count those born alive, but no longer living, as well as those alive now. Also include stepbrothers and stepsisters, and children adopted by your parents. childs How many children have you ever had? Please count all that were born alive at any time (including any you had from a previous marriage). agekdbrn How old were you when your first child was born? paeduc What is the highest grade in elementary school or high school that your father finished and got credit for? maeduc What is the highest grade in elementary school or high school that your mother finished and got credit for? padeg RESPONDENT’S FATHER’S (SUBSTITUTE FATHER’S) DEGREE madeg RESPONDENT’S MOTHER’S (SUBSTITUTE MOTHER’S) DEGREE dipged Was that a diploma awarded by your high school at graduation at the end of 12th grade, a GED awarded after you took a test, or something else? res16 Which of these categories comes closest to the type of place you were living in when you were 16 years old? in a small city or town (under 50,000), in a medium-size city (50,000-250,000), in a large city (over 250,000), in a suburb near a large city, in open country but not on a farm, farm reg16 In what state or foreign country were you living when you were 16 years old? mobile16 IF STATE NAMED IS SAME STATE R. LIVES IN NOW, ASK MOBILE16: When you were 16 years old, were you living in this same (city/town/county) as you live in now? family16 Were you living with both your own mother and father around the time you were 16? mawrkgrw Did your mother ever work for pay for as long as a year, while you were growing up? incom16 Thinking about the time when you were 16 years old, compared with American families in general then, would you say your family income was: far below average, below average, average, above average, or far above average? (PROBE: Just your best guess.) granborn (Were all of your four grandparents born in this country?..) IF NO: How many were born outside the United States? maborn Was (your mother/ your stepmother/ the female relative you were living with at 16) born in this country? paborn Was (your father/ your stepfather/ the male relative you were living with at 16) born in this country? adults Household Size and Composition: NUMBER OF MEMBERS OVER 17 YEARS OLD. 18+ YEARS unrelat (Is everyone in the household related to you in some way?..) IF NO: How many persons in the household are not related to you in any way? earnrs Just thinking about your family now–those people in the household who are related to you . . . How many persons in the family (including yourself) earned any money in [the last year] from any job or employment? size SIZE OF PLACE: Size of place in thousands is a 4 digit code which provides actual size of place of interview. Remember when using this code to add 3 zeros. Listed below are the frequencies for gross population categories. Auxiliary question set, which are embedded and added to a vector store, searched against a generated summary of the target question, and then re-ranked by our reranker model. The top 46 are then combined with the core demographic set to create the full question-answer context fed to the model. Full question text is not provided here for space.
- Publish Date
- July 1st, 2024
- Abstract
- By creating a retrieval augmented LLM pipeline, (RAG with OpenAI's GPT-4o), we explored the capability of LLMs to 'twin' real respondents in a publicly available survey. By providing the model context of previously answered questions from a particular respondent, we were able to achieve far better than random accuracy at masked questions. This opens the door to utilizing LLMs to augment known sentiment, extending surveys beyond the original question set and providing a far more flexible framework for working with qualitative data from real respondents and their 'digital twins'.
- Authors
 Destiny Ziebol